Carrier Fuel Cost Playbook
Diesel is up $2.78 a gallon. A playbook showing a 100-truck fleet how to cut fuel costs, recover revenue through fuel surcharges, and build the structure to keep both, worth an estimated $770K to $1.16M a year in fuel and efficiency alone.
By Michael Cafarelli
Download the playbook (PDF, 4 pages)
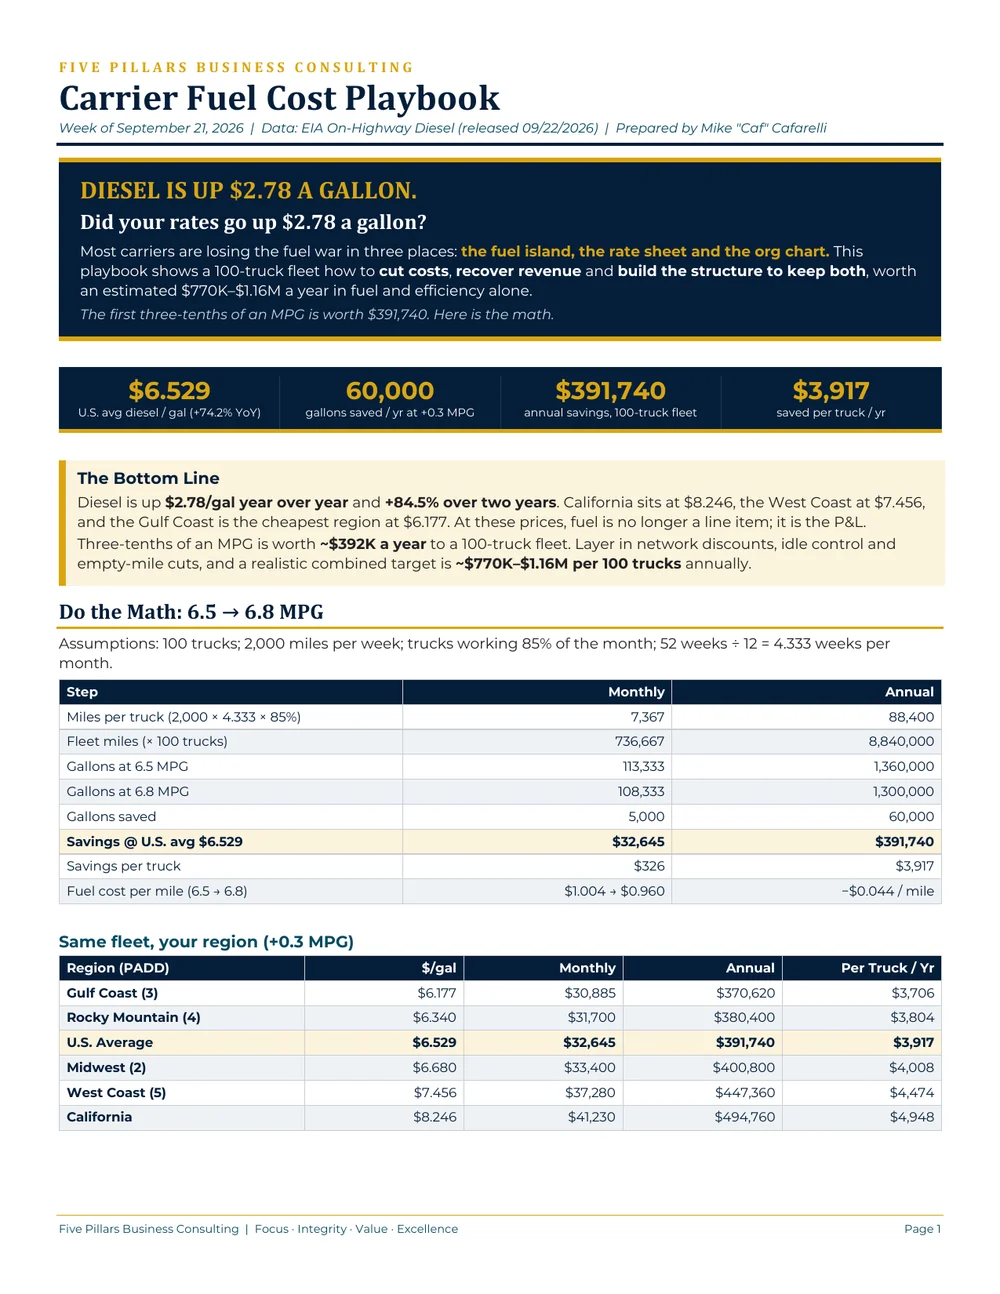
Most carriers are losing the fuel war in three places: the fuel island, the rate sheet, and the org chart. At these prices, fuel is no longer a line item. It is the P&L.
- $6.529U.S. avg diesel, $/gal (up 74.2% year over year)
- 60,000Gallons saved per year at +0.3 MPG
- $391,740Annual savings, 100-truck fleet
- $3,917Saved per truck per year
What's inside
- Do the math, 6.5 to 6.8 MPG. The full calculation for a 100-truck fleet, plus the same fleet priced by region (from $370,620 a year on the Gulf Coast to $494,760 in California) and a sensitivity table showing that every tenth of an MPG counts.
- The margin insight. A fuel surcharge built on a 6.5 MPG base does not move when your trucks get better, so every MPG gained above the base drops straight to operating margin.
- Maintenance levers that move MPG. Tire pressure, low-rolling-resistance tires, alignment, speed governance, trailer aero, idle reduction, lubricants, and engine health, each with typical impact, cost, and execution notes.
- Fuel purchasing. Cost-plus pricing at truck-stop networks, fuel-card controls, bulk fuel at the yard, and price protection on 20% to 40% of forecast volume.
- Route and fuel optimization software, with a recommendation to demand a 60 to 90 day pilot on 10 to 15 trucks against a written baseline.
- Out-of-the-box plays, from driver savings-share bonuses to auditing every fuel surcharge table.
- A Five Pillars scorecard and a 5-step checklist you can start this week.
What is on the table for a 100-truck fleet
| Lever | Annual value |
|---|---|
| MPG 6.5 to 6.8 | $391,740 |
| Network and bulk pricing ($0.10 to $0.40 per gallon) | $130,000 to $520,000 |
| Idle reduction (1 hour per day per truck) | $162,050 |
| Empty-mile reduction (1 point) | $84,877 |
| Total fuel and efficiency opportunity | $768,667 to $1,158,667 |
Calculated at the $6.529 U.S. average (EIA, week ending 9/21/2026), before any rate or fuel surcharge recovery. Savings ranges are industry benchmarks; actual results vary by duty cycle, equipment, and terrain. Provider listings are for evaluation only and do not constitute endorsement.
The playbook closes with an offer: a one-time Fuel & Margin Diagnostic covering a 90-day fuel-card and in-network purchase audit, an MPG, idle, and empty-mile baseline, a fuel surcharge review across your top 10 customers, your three biggest cost and revenue leaks with dollar values, and a 90-day action plan. Get in touch to learn more.
More from the blog

Secrets: Ways to Use Today's AI
A 15-second look at RicavaIQ's Secrets: Ways to Use Today's AI, a cross-platform prompt manual with 850 deployable prompts across 17 disciplines and five AI platforms.
Watch
Weekly Market Intelligence: Week of October 5, 2026
Linehaul rose in all three truckload modes for the first time since early September while diesel fell a second straight week. An 11-page market intelligence package on reefer, LTL, dry van, flatbed, tender declines, fuel surcharges, and regional diesel.
View & download
Weekly Market Intelligence: Week of September 28, 2026
The diesel run broke while the freight tape had not yet caught up: all-in rates rose in every mode on a fuel number that had already reversed, and linehaul was flat or down. An 11-page market intelligence package.
View & download